WEATHER
Concept of Weather
Meaning of Weather
Define weather
Weather is defined as conditions of the atmosphere which occur at a place at specific time periods, that is, from hour to hour or day to day. It changes from time to time and from place to place. For example, it may be raining in the morning and sunny in the afternoon.
Weather may also be defined as the day-to-day state of the atmosphere, and its short-term variation in minutes to several weeks.
How do you feel when seated in a classroom on a cloudy day? You probably feel cold. Don’t you? Now, suppose you move outside the classroom on a sunny day and stay there for several minutes. Your body will obviously feel hot and may even start to sweat. What does this experience tell you about the weather?
The weather is all around us, all the time. It is an important part of our lives and one that we cannot control. Instead the weather often controls how and where we live, what we do, what we wear and what we eat.
The scientific study of weather is called meteorology and a person who studies weather is called meteorologist.
Importance of Weather
Describe the importance of weather
Weather is an important part of the natural environment. It directly or indirectly affects many of our activities. The following are some of the reasons why weather is important to mankind and the surrounding environment:
- Weather is one of the fundamental processes that shape the Earth. The process of weathering breaks down the rocks and soils into smaller fragments and then into their constituent substances. In this way, weather plays a major role in erosion of the surface soil, hence shaping the earth.
- The weather of any given region is important because it has a considerable impact on the water, sunlight and temperature of an ecosystem. Variation in long-term weather patterns and tendencies can result in certain regions getting more or less water or sunlight than other areas. These factors play an important role by influencing the type of plants and animals that can survive in the area.
- Certain weather patterns can also cause dangerous storms and natural disasters. We tend to be acutely aware of the weather when we are faced with exceptional or dangerous phenomena that could endanger our property, safety or even lives. Such phenomena are, for example, strong winds, hail, heavy rainfall, sleet, ice and frost.
- Studying weather characteristics of a given place over along period of time (usually 30 to 40 years) enables the climatic conditions of that place to be established. Therefore, weather can be used as a basis for determining the climate of a given place.
- The knowledge of weather (and hence climate) enables people to carry out their economic activities depending on the weather and climatic conditions of their localities. For example, people living in cold areas which receive high rainfall can engage in dairy farming and the growing crops such as tea, coffee, banana, etc.
The Relationship between Weather and Human Occupations
Show the relationship between weather and humans occupations
There is a direct relationship between the weather condition and nature of human activity. Due to the fact that deserts experience very hot weather, it will be surprising to see tea or banana tree growing there. This way we can see a clear connection between the two. E.g, during rainfall, construction companies experience lows in business and meanwhile floods hinder transport on rivers.
Elements of Weather
Elements of Weather
Name elements of weather
Weather elements refer to a combination of natural phenomena that make up the weather. There are several elements that make the weather and climate of a place. The weather elements are temperature, pressure, precipitation, wind, humidity, clouds and sunshine.
The study of these elements can provide the basis for forecasting weather and defining the climate. Now, let us study each element in more details:
Temperature
The temperature is how hot or cold the atmosphere is, usually measured by a thermometer and expressed in degrees on a Centigrade or Fahrenheit scale. There are several types of thermometers. The maximum thermometer shows the highest temperature reached during a given period, for example a day; while the minimum thermometer shows the lowest temperature recorded (the figure below shows maximum and minimum thermometers).
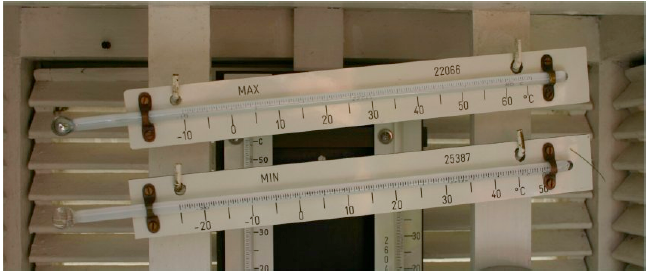
Maximum and minimum thermometers
The maximum thermometer is made of glass and contains mercury in the bulb. Theminimum thermometer is also made of glass but contains alcohol instead of mercury. The thermometer is marked in degrees of Centigrade or Fahrenheit. When the temperature rises, the mercury expands and extends along a glass tube. Changes in temperature are shown by the length of mercury. For example, if the lowest temperature reads 12.5°C and the maximum temperature reads 24.0 °C, then the changes in temperature is calculated as 24.0 – 12.5 = 11.5°C.
The Six’s thermometer can also be used for measuring maximum and minimum temperature. The thermometer consists of a U-shaped glass tube. The metal index nearest to the bulb indicates the minimum temperature and the other metal index records the maximum temperature.
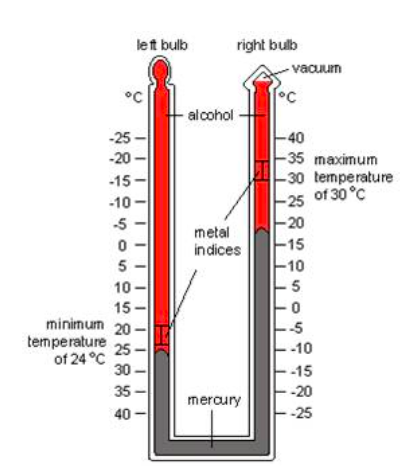
Six’s Thermometer. Can you read the max temperature and min temperature?
Temperature is a very important factor in determining weather. It influences or controls other elements of weather, such as precipitation, humidity, clouds and sunshine. The factors affecting (modifying) temperature include latitude, altitude, distance to the ocean and/or sea, orientation of mountain ranges toward prevailing winds (aspect) and ocean currents.
Reading and recording temperature
The maximum and minimum temperatures which are recorded for the day are used to calculate:
- daily range of temperature, which is the difference between the maximum and minimum temperatures; and
- the daily mean, which is the average of maximum and minimum temperatures.
Maximum + Minimum/2 = Daily mean
The monthly range of temperature is the difference between the highest daily mean temperature and the lowest daily mean temperature. To get the lowest mean temperature for a particular month, add up the mean daily temperatures and divide by the number of days in that month. For example, the mean monthly temperature for January is given by:
M1 +M2 +M3 + ...... Mn/32 where M1, M2, M3…….Mn are the mean daily temperatures for days 1, 2, 3……n; and 31 is the number of days in January. The same formula can be applied to obtain the maximum daily mean temperature for a particular month.
The annual range of temperature in a particular year is the difference between the highest mean monthly temperature and the lowest mean monthly temperature.
When reading and recording of data is done over a period of time, the obtained data can be shown on maps. These maps are called temperature maps. When comparing the temperature in different parts of the world, it is usual to make use of temperature maps. Different places with the same temperature conditions can be joined on the map by lines called isotherms.
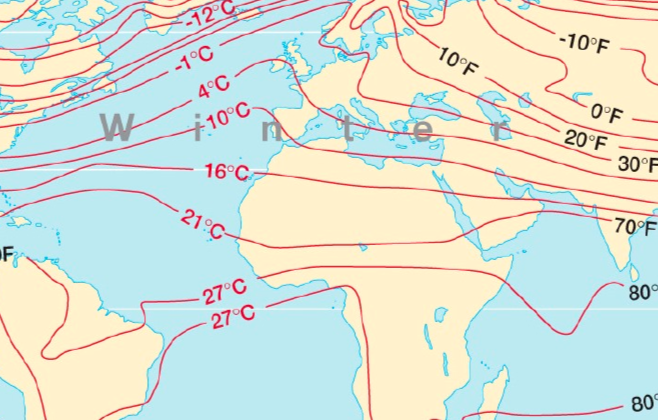
Isotherms
Relationship between temperature and altitude
Temperature decreases at the rate of 0.6°C for every 100 metres increase in altitude. Therefore, temperatures in highland areas are lower than temperatures in lowlands.
Apart from isotherms, another way of presenting the temperature data is using a graph. In this case, temperature figures are plotted on the graph and points are joined by a smooth line.
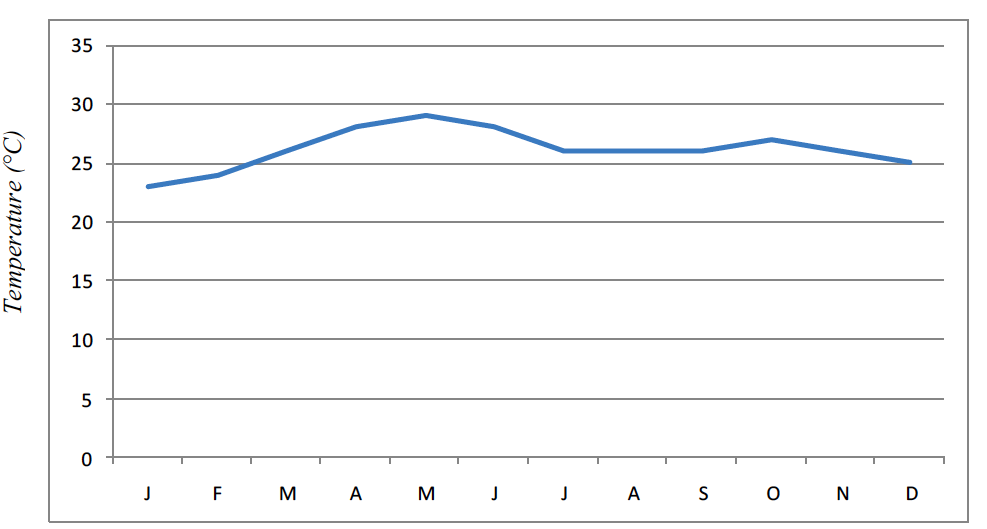
Average monthly temperature for Station X
Precipitation
This refers to the deposition of moisture on the earth’s surface from the atmosphere. This moisture includes rain, snow, ice, hail, mist and sleet.
Demonstrating the formation of rain
Boil some water in a pot. Just as the water starts boiling, hold a container filled with cold water over the pot. As the steam comes in contact with the container, it condenses to form droplets which will then fall down. This explains how rain is formed.
The sun’s heat causes water to evaporate from the surface of the oceans, lakes, rivers other water bodies, and land. This vapour rises into the atmosphere where it condenses to form clouds. Because the air is cooler at higher altitudes, the vapour is cooled to form small droplets that join together to form larger drops which are then too heavy to remain in the air, so they fall as rain. The diagram below shows the water cycle, also called the hydrologic cycle.
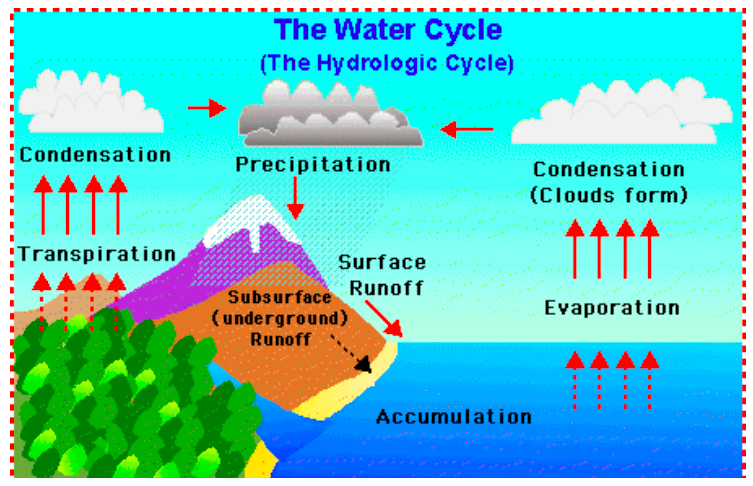
The hydrologic cycle
Types of rain
There are three types of rain as explained below:
Convection rain
This is a rain formed through the rising of the moist air currents, which condenses at higher altitudes to form clouds that result to rainfall.
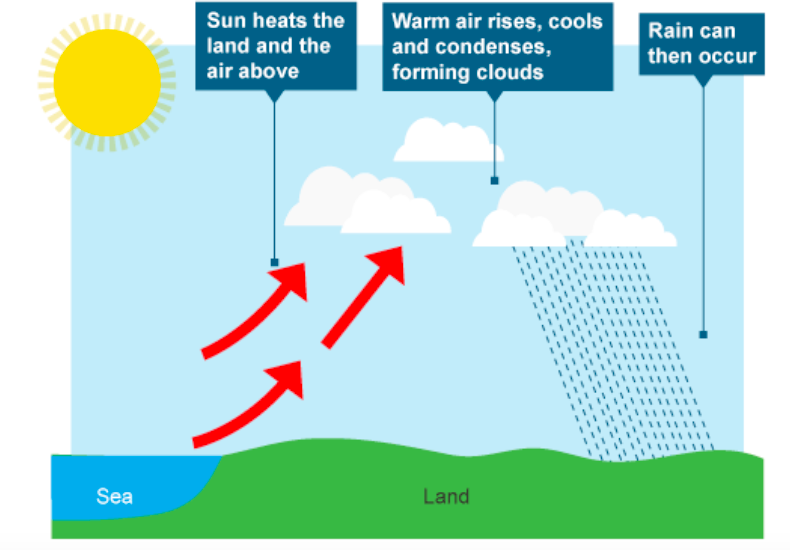
Convection rain
Orographic rain or relief rain
Sometimes moist winds are forced by a high mountain to rise and the moisture in it condenses to form rain. Rain formed in this way is called orographic rain. The side of the mountain facing away from the direction of wind gets little or no rain. This phenomenon is called the rain shadow effect.
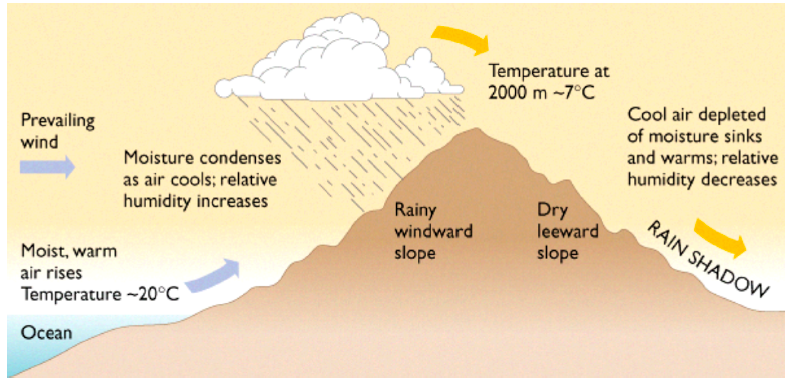
Orographic rain
An example of the rain shadow effect in Tanzania is found on the western side of Mount Kilimanjaro. Winds blow from the Indian Ocean in the east and are forced by this Convection rain mountain to rise up and drop moisture on the eastern and south western slopes. When these winds blow over to the western side of the mountain, they are already relatively dry. As a result, they bring very little rain to the Masai steppe. Other examples are the Rocky Mountains which affect the rain-bearing winds from the Pacific; and the Andes in Chile which affect the rain bearing winds from the Pacific on the Patagonia plateau.
Cyclonic rain
Cyclonic rain occurs when large masses of air with different characteristics of temperature and moisture meet. As the warmer and moist air is forced up over the cooler and dry air, it expands, cools and water vapour condenses to form clouds and rain.
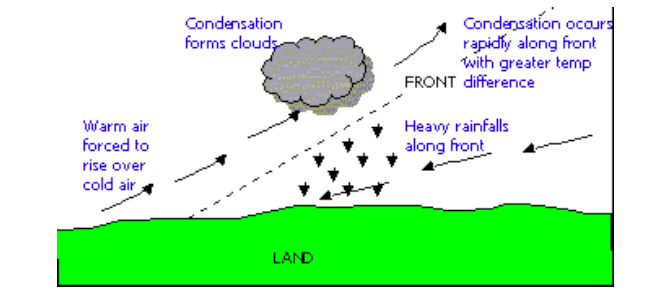
Cyclonic rain
On the other hand, tropical cyclones are formed over oceans in the tropics between latitude 8°N and 8°S. They usually bring very heavy rainfall and are associated with thunderstorms and very fast moving winds which often cause destructions along coastal settlements. In the Caribbean and USA, tropical cyclones are called hurricanes. In Africa they are known as cyclones, while in China and Japan they are called typhoons but in North Australia they are known as Willy–Willies.
Rainfall is measured by an instrument called rain gauge. Normally, the reading is done once every 24 hours. If need be, comments on the nature, time and duration of rainfall should be added to the record.
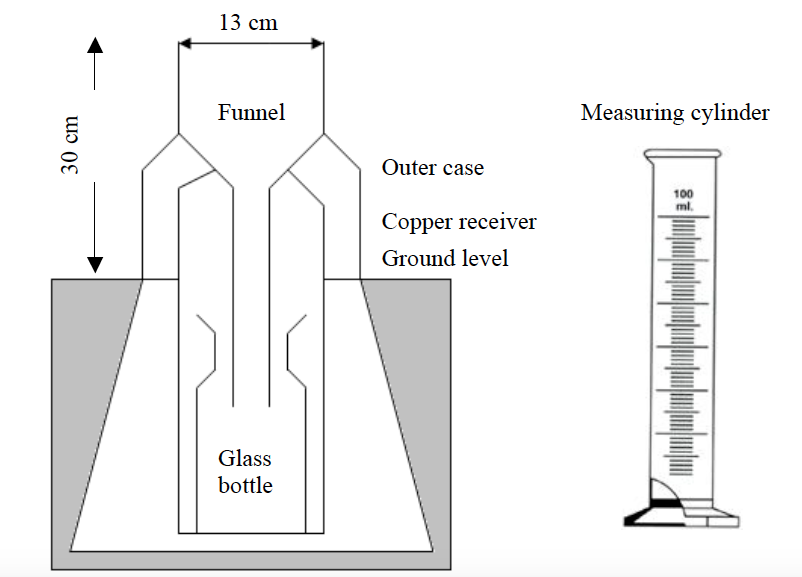
THE RAIN GAUGE
Rainfall figures entered in the record book for the month or several months can be represented in the form of graphs known as histograms (see the histogram below). Mean monthly rainfall records are usually obtained by adding up rainfall of a particular month (say January) for a number of years (say 30 years) and dividing this by the same number of years.
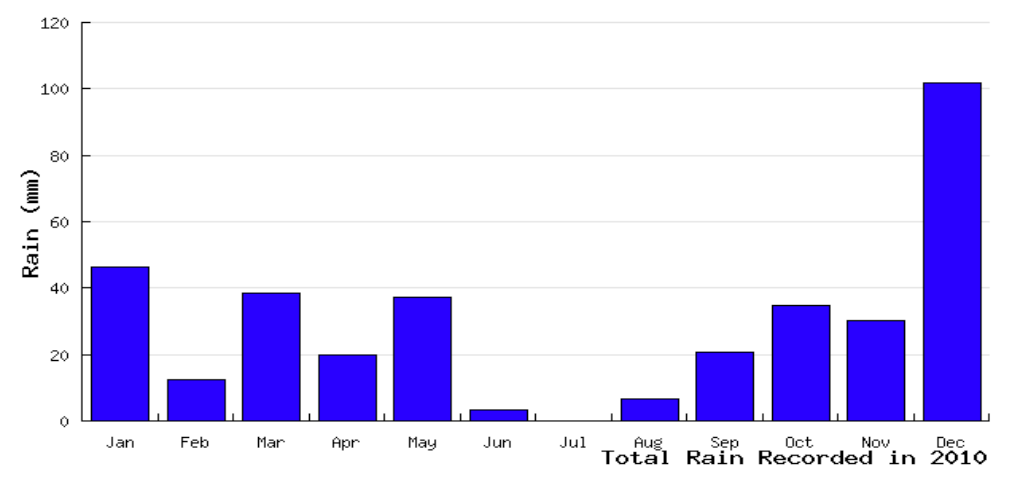
Total annual rainfall recorded at Weather Station X
Another way of presenting rainfall figures is by drawing lines on a map to link all places that receive the same amount of rainfall. These lines are called isohyets. They are usually drawn at uniform intervals.
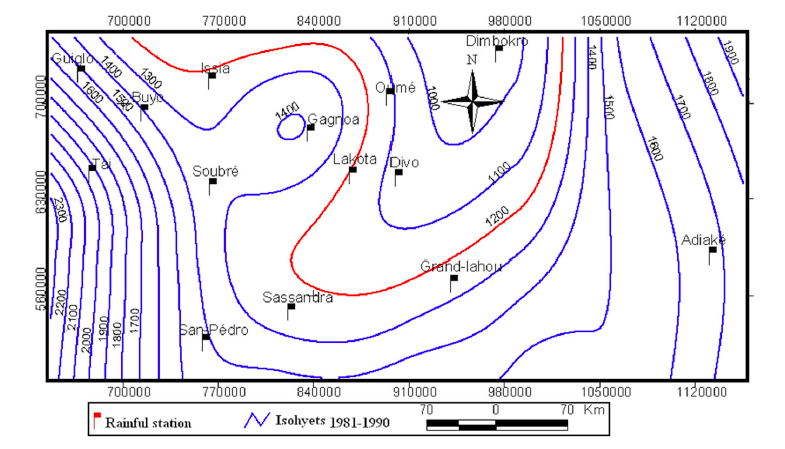
Isohyets
Importance of precipitation
Precipitation, especially rainfall, plays an important role in weathering of rocks. It dissolves the chemicals in rocks, thus helping to peel them apart. This action is called weathering. The weathered rocks in turn form the soil. Weathering is particularly influenced by temperature and rainfall.
Some sports such as skiing, skating, etc take place on frozen snow. Therefore, snow as a form of precipitation, acts as a playground on which numerous games and sports can take place.
Rain provides us with the water we need for various uses such as irrigation, drinking, washing, cleaning, etc. When it rains, water collects into streams and rivers from where it is collected, purified and supplied to homes for various purposes. Rain can be harvested directly as it falls from the sky. It is then stored in tanks for later use. Rain water is natural, pure and can be used without any further purification.
Rain is an important component of the water cycle and is responsible for depositing most of the fresh water on the earth. It provides suitable conditions for many types of ecosystems, as well as water for hydropower plants.
Humidity
Humidity is the state of the atmosphere in relation to the amount of water vapour it contains. Humidity indicates the degree of dampness of the air, and is one of the main influences on weather. It is expressed in either absolute or relative terms. Absolute humidity is the actual amount of water vapour present in a certain volume of air at a given temperature, expressed in grams per cubic metre. Relative humidity is the amount of water vapour present in a mass of air, expressed as a percentage of the total amount of water vapour that would be present when that air is saturated at that temperature. Air is saturated when the atmosphere cannot hold any more water vapour. This condition depends on the temperature and pressure of the air.
Humidity is measured by an instrument called hygrometer, which consists of wet and dry bulb thermometers. The wet bulb thermometer is kept moist (wet) by wrapping it in a muslin bag which is dipped in a container of distilled water. When the air is not saturated, water evaporates from the muslin and this cools the wet bulb causing mercury to contract. The dry bulb is not affected in the same way. So the two thermometers show different readings. But when the air is saturated the two thermometers show the same readings. Therefore, when there is a big difference in readings between the two thermometers, humidity is low and when there is a small difference, humidity is high.
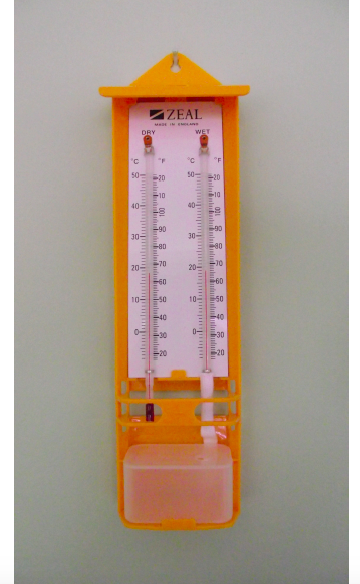
A hygrometer
The hygrometer consists of dry (left) and wet (right) bulb thermometers. Can you notice a muslin bag dipped in a container of water?
Absolute humidity is calculated after finding the dew point. Dew point is the critical temperature at which air becomes saturated with water vapour. Further condensation causes the formation of tiny drops of water called dew.
Atmospheric pressure
The air around us has weight. Atmospheric pressure (or air pressure) is the weight of the air resting on the earth’s surface. It is the weight exerted by air on the earth’s surface.
The force with which air presses down on a unit area is called atmospheric pressure. But this pressure is exerted equally in all directions. Atmospheric pressure can be demonstrated by the following experiment:
Take a glass full of water, cover the top of the glass with a piece of thin paper, and then hold the glass upside down. The water in the glass will not spill out because pressure of the air is pressing the paper so that it does not fall out.
Atmospheric pressure is measured by an instrument called a barometer. There are two types of barometers, mercury barometer, and aneroid barometer. Mercury barometer measures pressure in millimetres, usually expressed symbolically as mmHg, read as millimetres of mercury. The pressure at sea level is 76 mmHg. This is called standard pressure.
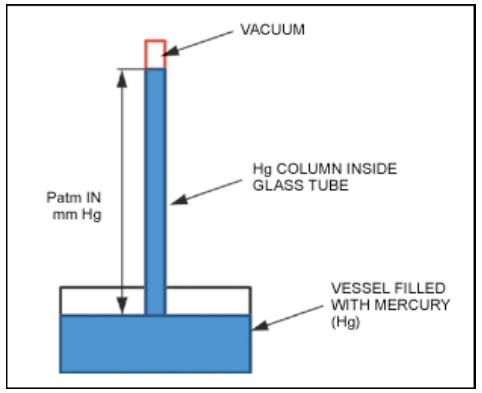
Simple mercury barometer
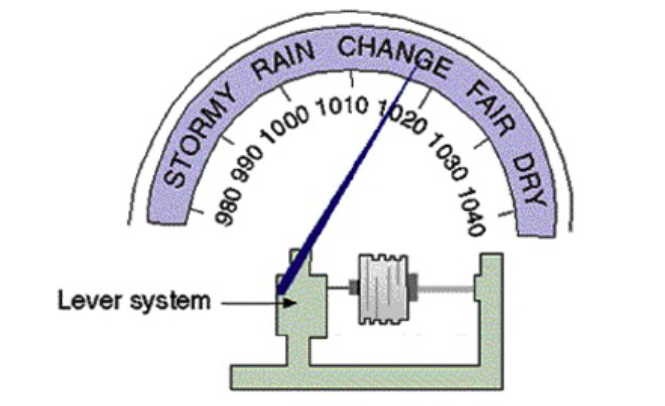
Aneroid barometer
Pressure is expressed in millimetres with reference to the height of mercury column. When using an aneroid barometer we express pressure in millibars of force per unit area. In physics, a unit of force known as a “dynes” per square centimetres is called a “bar” and is now the standard unit of pressure measurement. A bar is then divided into one thousand units called millibars. At sea level, pressure is normally 760 mmHg or 1.034 kilograms of force per square centimetre. This is equivalent to 1015.9 millibars or approximately one bar.
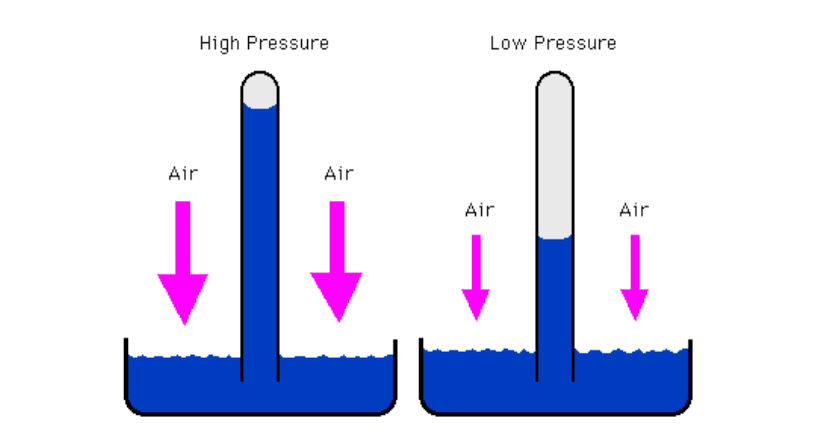
The diagram below shows the height of mercury column at high and low pressures. When the atmospheric pressure is high, mercury level is pushed up the glass tube. At low pressures, mercury column drops down.
Pressure is shown on a weather map, usually called synoptic map. Lines drawn on a weather map joining places with the same pressure are called isobars.
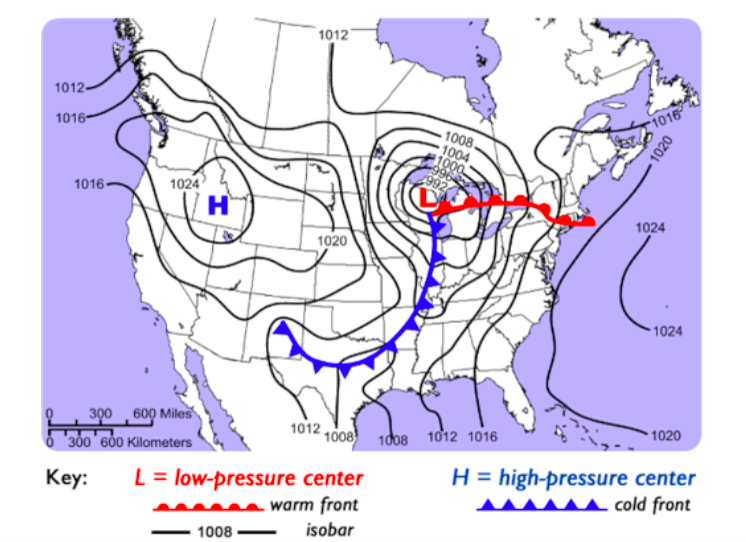
Isobars
The pressure is greatest at sea level where the whole thickness of the atmosphere exerts its weight. But pressure decreases at the rate of 10 millibars for every 100 metres increase in height. This is because the thickness of the atmosphere decreases, thus it exerts less pressure.
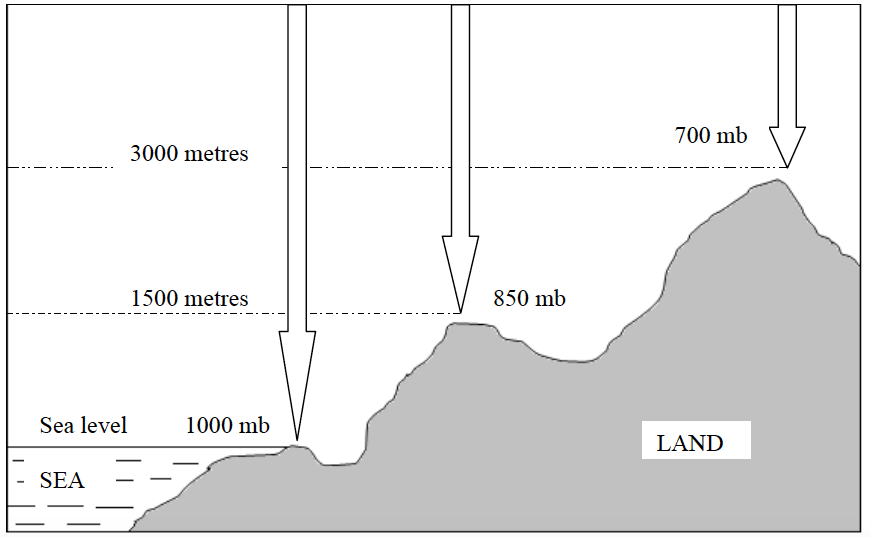
Relationship between pressure and altitude
Winds
Wind is the movement f air masses especially on the earth’s surface. Heated air expands, becomes less dense and rises up. Cooled air contracts, becomes denser and sinks down. When air sinks, its pressure increases because it is compressed, but when air rises, its pressure decreases because its molecules are spread over a large area. Areas from where heated air is rising are called areas of low pressure, while areas in which cool air is sinking are called areas of high pressure.
Usually, there is a movement of air from high pressure to low pressure areas, which is caused by differences in heating of air over different parts of the earth’s surface. The air that moves from a region of high pressure to that of low pressure is called wind. Wind is air in motion, from high pressure areas to low pressure areas.
During the day the land is usually warmer than the sea, and the air pressure on the land is lower than that over the sea. Therefore, air blows from sea to land. This kind of air movement (wind) is known as sea breeze. But during the night the land is cooler than the sea and there is low pressure on the sea. Therefore, winds blow from the land to the sea. This air movement is called land breeze.
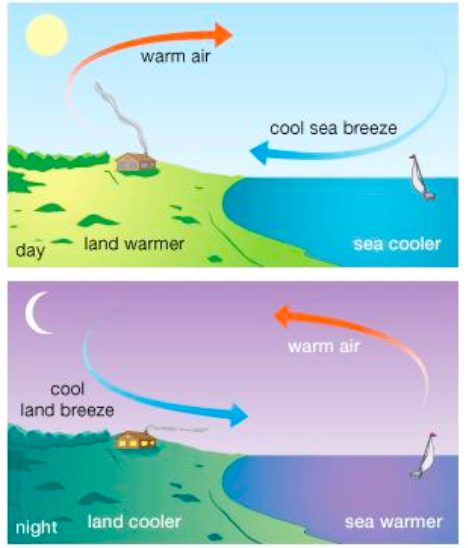
Sea breeze (day) and land breeze (night)
On the Earth’s surface, the regions of the north and south poles are very cold and have high pressure while the belt along the equator is very hot and has low pressure. This makes air move from the poles towards the equator. In the equatorial belt, rising air is replaced by air moving in from the north and south of the equator. We should then expect two belts of wind blowing towards the equator. But this is not exactly so because the earth rotates from west to east, and according to Ferrel’s law air or water moving freely in any direction over the Earth’s surface is turned (deflected) to the right of its course in the northern hemisphere and to the left in the southern hemisphere. Therefore, any winds blowing from the north towards the equator in the northern hemisphere will blow from the north east and not from the north, and any winds blowing from the south towards the equator in the southern hemisphere will blow from the south east and not from due south.

Winds blowing from NE and SE
In the equatorial belt of low pressure, between 5°N and 5°S latitudes, intense solar heating causes the moist air to rise in great convection columns. This belt is called the doldrums or low pressure belt. The rising air spreads out and moves towards the poles. In so doing, it cools and thus contracts, and develops high pressure. This occurs around 30°N and 30°S. Thus, the air sinks and builds up high pressure at these latitudes. These latitudes are called horse latitudes or subtropical high pressure cells.
In latitudes 30°N and 30°S some of the high pressure air moves over the surface towards the equator as the north east and south east trade winds. Some moves over the surface towards the poles as westerlies.
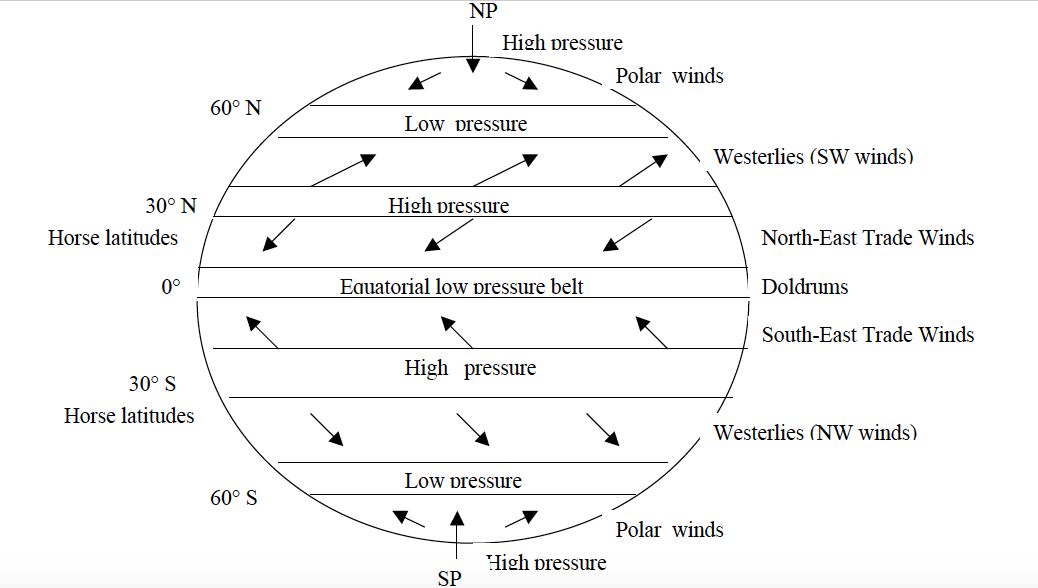
Wind belts of the world
In each hemisphere, there are three wind systems which operate between the indicated latitudes:
- The Polar wind system (between the North Pole and 60°N; and between the South Pole and 60°S).
- The tropical wind system (between 30°N and 60°N; and 30°S and 60°S).
- The equatorial wind system (between 30°N and 30°S).
Occasionally in the westerly wind system, depressions and anticyclones develop. A depression is an area of low pressure in which winds blow inwards in a circular motion. This motion is anti-clockwise in the northern hemisphere and clockwise in the southern hemisphere. A depression develops when cold heavy air comes in contact with warm most air. Depressions are usually associated with cyclonic rains. Anti-cyclones are areas of high pressure in which winds blow in a clockwise, circular motion in the northern hemisphere. They are associated with cool fine weather with no rain and they normally follow a depression.
Wind direction is measured by a wind vane or wind sock.
The wind vane consists of a freely rotating arm, fitted over a central rod. The arrow of the wind vane always points in the direction from which the wind blows, and the wind is named after this direction. Four arms marking the direction of the cardinal points are fixed to the stationary central rod.
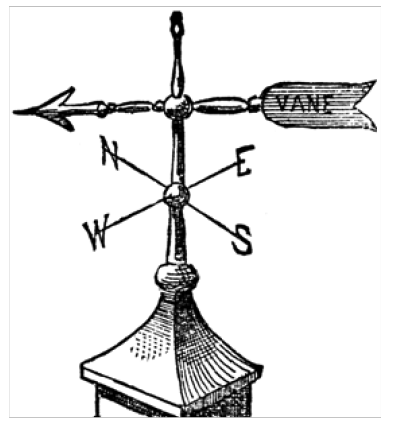
A wind vane
Wind sock consists of a sock-like sheet of cloth fitted to top of a tall wooden or metal bar, just like the flag is fitted to the flag post. The tail of the sock points away from the direction of wind, and the direction of wind is named after the head of the sock.
Wind socks are mainly used to show wind directions at airports and airstrips in order to direct pilots when landing or taking off.
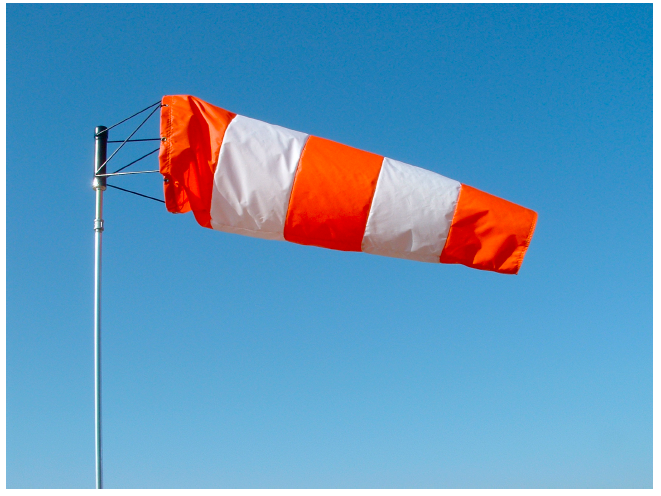
Wind sock
Wind speed is measured by an instrument called an anemometer. This instrument consists of three or four horizontal arms pivoted on a vertical shaft. Metal caps are fixed to the end of the arms so that when there is a wind the arms rotate. This movement operates a meter which records the speed of wind in kilometres per hour.
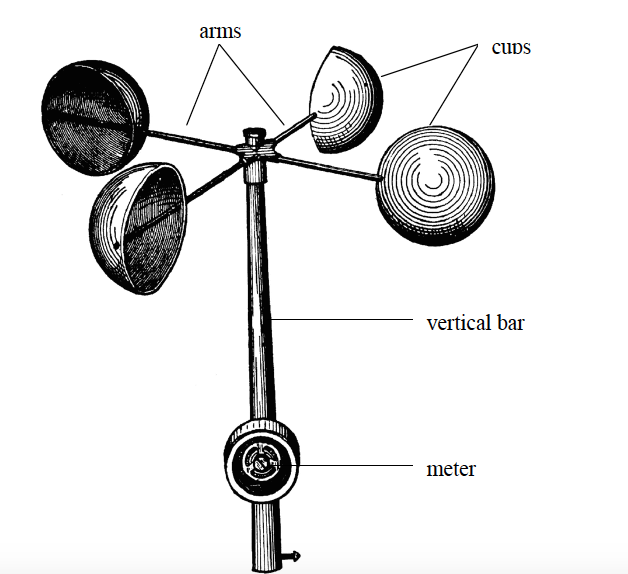
Anemometer
Cloud cover
Cloud cover (also known as cloudiness, cloudage or cloud amount) refers to the fraction of the sky obscured by clouds when observed from a particular location. The cloud cover is observed by using eyes. There is no special instrument for recording the cloudiness. Okta is the usual unit of measurement of the cloud cover. One okta represents approximately 1/8 of the sky with cloud cover. If approximately 3 segments out of 8 are covered in clouds, then the cloud cover is written as 3/8 cloud cover. These are 3 oktas. 8/8 means the cloud is completely covered by clouds. The figures below represents the symbols used to represent cloud cover in oktas.
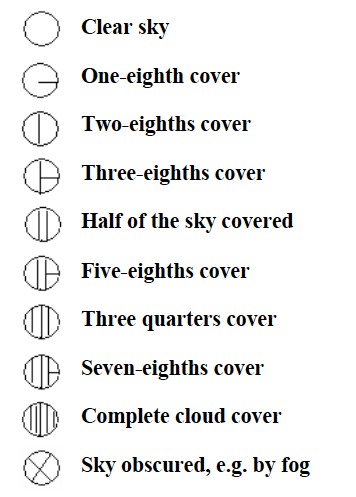
Symbols used to show cloud cover
Simple observation can be made such as:
- Clear - no cloud cover.
- Partly cloudy - less than half cloud cover.
- Mainly cloudy - more than half cloud cover but with some breaks in the cloud.
- Overcast - complete cloud cover.
Sunshine
The amount of sunshine we have depends on latitude and how much cloud there is in the sky. In some of the world's deserts the number of sunshine hours is very high, more than 3,600 hours each year. In the Eastern Sahara desert, the sun is covered by clouds for less than 100 hours a year.
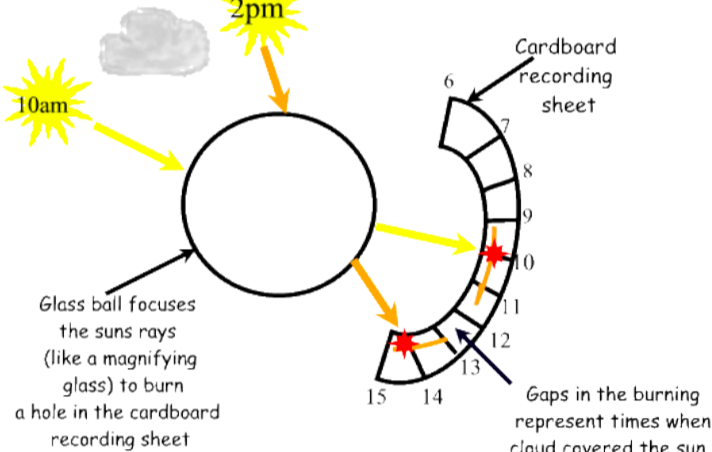
Hours of sunshine are usually recorded on a simple machine called a parheliometer also known as a Campbell-Stokes recorder.
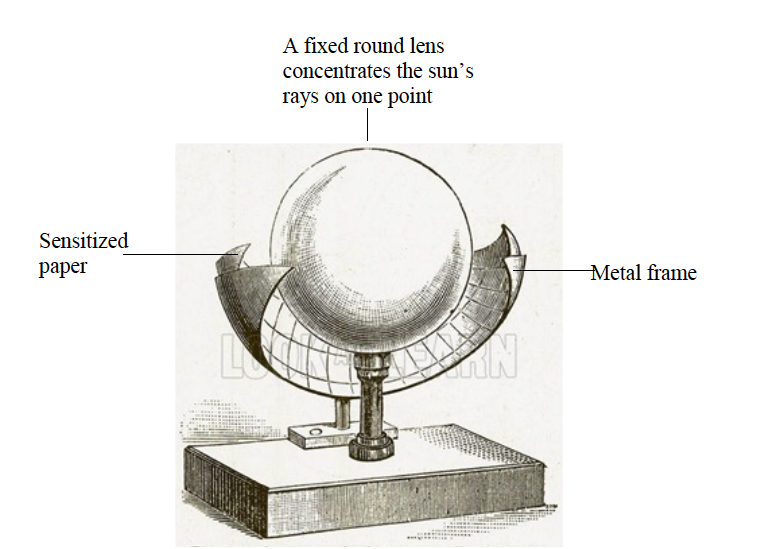
Campbell’s Sunshine Recorder
It works by using a glass ball to focus the sunlight and rays onto a strip of card. As the sun moves round during the day, the card is scorched, creating a record of how many sunshine hours there were.
Importance of sunshine
The energy from the sun can be trapped, harnessed and put into various uses including cooking, heating, lighting and operating machines. It also affects the amount of heat received on the earth. When the sun shines for many hours, the temperature of the earth rises and when there is no sunshine the temperature drops down.
The sun’s energy is used by green plants to make their own food through the process of photosynthesis. Solar energy is also used to dry crops, clothes, etc. Our skins are also capable of converting the solar energy into vitamin D.
Evaporimeter
An evaporimeter is an instrument used to measure the speed and amount of evaporation of water from the surface of the earth. There are two types of evaporimeters:
Tank evaporimeter—measures evaporation from an open and free water surface. The tank is filled with water to a known level and then exposed in an open area which is free from obstructions where water is left to evaporate. The water level is measured using a micrometer screw gauge. Any reduction in the level of water is because of evaporation.
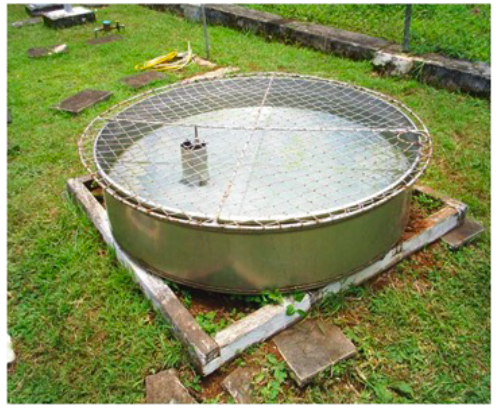
Tank evaporimeter
Piche evaporimeter—measures evaporation from a continuously wet and porous surface.
Importance of Elements of Weather
Explain the importance of each element
Importance of temperature
- Temperature is an important factor in rain formation. Temperature causes the evaporation of water vapour from water bodies, land and plants. The resulting water vapour then condenses to make clouds that form rain.
- Temperature is the main factor in the creation of wind. When the sun heats the earth’s surface unevenly, the resulting changes in temperature create changes in pressure and density. The ultimate result of these changes is the movement of air from a region of high pressure (cold area) to an area of low pressure (heated area). This movement of air is called wind.
- Plant growth and development is also highly influenced by temperature. It affects transpiration, seed germination and the rate of photosynthesis in different ways.
- Temperature controls planting dates and the growth of plants as well as insect pests and crop diseases. As an integral part of weather, temperature also determines the type of precipitation that might occur if you are in a location that is experiencing near freezing.
Weather Station
Meaning of Weather Station
Define weather station
A weather station is a facility, either on land or sea, with instruments and equipment for measuring atmospheric conditions to provide information for weather forecasts and to study the weather and climate. The measurements taken include temperature, barometric pressure, humidity, wind speed, wind direction, and precipitation amounts.
Wind measurements are taken with as few as other obstructions as possible, while temperature and humidity measurements are kept free from direct solar radiation, or insolation. Manual observations are taken at least once daily, while automated measurements are taken at least once an hour. Weather conditions out at sea are taken by ships and buoys, which measure slightly different meteorological quantities such as sea surface temperature, wave height, and wave period.
Weather station data can be used to gauge current weather conditions and to predict the future weather forecast, like temperature high/lows, cloud cover and probability of precipitation. Weather stations are used by meteorologists, weather buffs, gardeners, farmers, outdoor enthusiasts, students, pilots and anyone who enjoys weather data or relies on the weather to make decisions.
How to Establish Elements of Weather
Explain how to establish elements of weather
Selecting an appropriate site for the weather station is critical for obtaining accurate meteorological data. Typically, the site should represent the general area of interest, and be away from obstructions such as buildings and trees.
When establishing a weather station the following guidelines must be considered:
- The station should be located on an open space with free circulation of air.
- There should be a wide view of the surrounding landscape and the sky.
- The site should be free from obstructions by trees, buildings, mountains, etc. The station should not be under the shadows of objects. The open areas should be covered by short grass, or where grass does not grow, the natural earth. Avoid large industrial heat sources, rooftops, steep slopes, sheltered hollows, high vegetation, shaded areas, swamps, areas where snow drifts occur or low places holding stagnant water after rains.
- The ground should be plain or gently sloping at a gradient not more than 5°.
- The station should be fenced to keep off intruders, trespassers and passers-by and should always be locked. Only authorized people should have access into the station.
- The geographical location of the station should be established by placing a compass in the station. This will help in determining the direction of wind shown by a wind sock /vane put in the station.
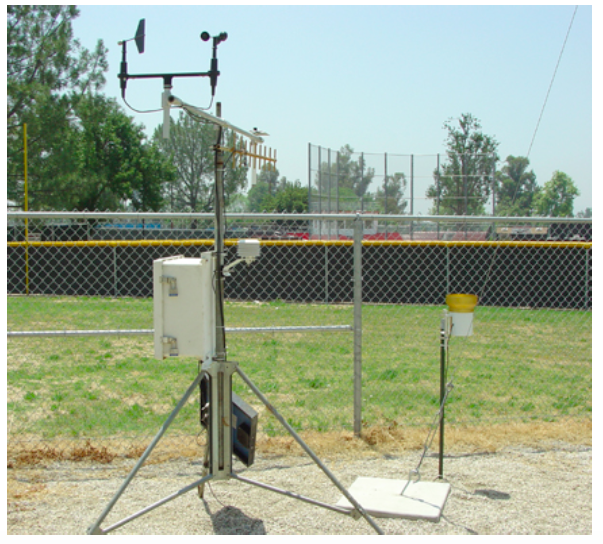
A weather station
Characteristics of a Stevenson Screen
Describe characteristics of a Stevenson screen
A Stevenson screen or instrument shelter is an enclosure intended to shield meteorological instruments against precipitation and direct heat radiation from outside sources, while still allowing air to circulate freely around them. It forms part of a standard weather station.
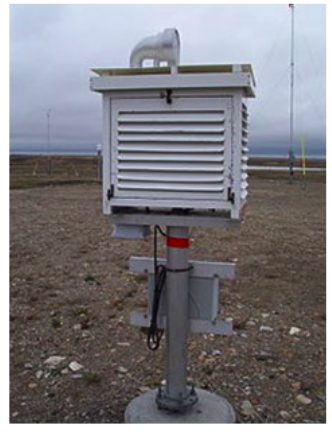
Exterior of a Stevenson screen
Characteristics and Functions of Instruments Used to Measure the Elements of Weather
Describe the characteristics and functions of instruments used to measure the elements of weather
The Stevenson screen holds instruments that may include thermometers (ordinary, maximum/minimum), a hygrometer, a psychrometer, a dew cell, a barometer and a thermograph. Its purpose is to provide a standardized environment in which to measure temperature, humidity, dew point and atmospheric pressure.
The traditional Stevenson Screen is a box shape, constructed of wood, in a doublelouvered design. However, it is possible to construct a screen using other materials and shapes, such as a pyramid. The World Meteorological Organization (WMO) agreed standard for the height of the Stevenson Screen is between 1.25 m and 2 m above the ground.
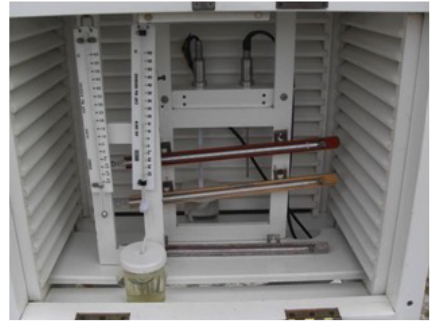
Interior of a Stevenson screen
The siting of the screen is very important to avoid data degradation by the effects of ground cover, buildings and trees. It is recommended that the screen be placed at least twice the distance of the height of the object, e.g., 20 m from any tree that is 10 m high. In the northern hemisphere, the door of the screen should always face north so as to prevent direct sunlight on the thermometers. In polar regions, with twenty-four hour sunlight, the observer must take care to shield the thermometers from the sun and at the same time avoiding a rise in temperature being caused by the observer's body heat.
The general purposes of the Stevenson Screen are:
- to ensure the safety of the delicate instruments kept in it which could easily be damaged if kept in the open air;
- to ensure accurate measurements of the meteorological data; and
- to protect instruments against precipitation and direct sunlight and heat, while still allowing air to circulate freely around them.
Measuring Elements of Weather
Measure and record elements of weather
Activity 1
Measure and record elements of weather
The Meaning of Weather Forecasting and How it is Done
Describe the meaning of weather forecasting and how it is done
Weather forecasting is the application of science and technology to predict the state of the atmosphere for a given location.
Weather forecasting methods
The nature of modern weather forecasting is not only highly complex but also highly quantitative. There are several different methods that can be used to create a forecast. The method a forecaster chooses depends upon the experience of the forecaster, the amount of information available to the forecaster, and the level of difficulty that the forecast situation presents. The various methods used in forecasting the weather are as follows:
Numerical method
More recently it has been realized that other methods can more accurately predict the future weather than was possible in the past. The numerical method involves a lot of mathematics. This method is based on the fact that gases of the atmosphere follow a number of physical principles. If the current conditions of the atmosphere are known, these physical laws may be used to forecast the future weather.
Numerical weather forecasting is made possible by making observations of the atmosphere by means of radiosonde stations all over the world. A radiosonde is a small weather station coupled with a radio transmitter. The radiosonde is attached to a helium or hydrogen-filled balloon, generally called a weather balloon, and the balloon lifts the radiosonde to altitudes exceeding 30 km. During the radiosonde’s ascent, it transmits data on temperature, pressure, and humidity to a sea-, air-, or land-based receiving station. Often, the position of the radiosonde is tracked through GPS, radar, or other means, to provide data on the strength and direction of winds aloft. Thus the radiosonde flight produces a vertical profile of weather parameters in the area above which it was launched.
At precisely the same time each day (0000 and 2400 UTC), weather personnel across the planet release radiosondes to the sky. The data obtained are processed, correlated with data from other radiosondes, and used to create an instantaneous picture of weather conditions throughout the world. The data are used not only to understand current weather patterns but also as inputs for longer-range computer-based forecasting models.
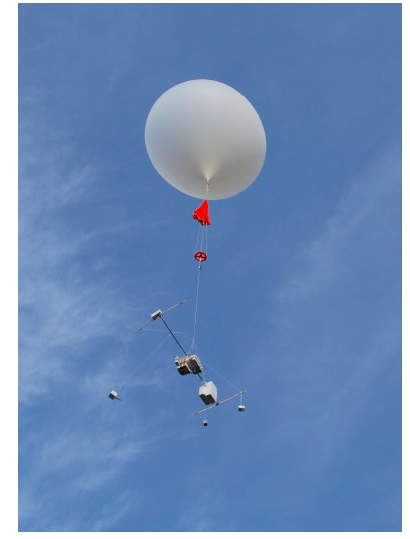
A radiosonde
Satellites
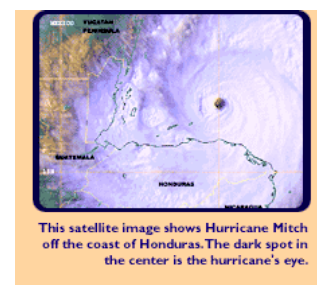
Radiosonde data are supplemented by means of radiometric observations from satellites which also provide data on humidity and cloud cover. For viewing large weather systems on a worldwide scale, weather satellites are invaluable. Satellites show cloud formations, large weather events such as hurricanes, and other global weather systems. With satellites, forecasters can see weather across the whole globe: the oceans, continents, and poles. Recent satellite data is very detailed, even to the point of showing states and counties.
Persistence method
This is the simplest way of producing a forecast. This method assumes that the conditions at the time of the forecast will not change. For example, if it is sunny and 30°C today, the persistence method predicts that it will be sunny and 30°C tomorrow. If ten millimetres of rain fell today, the persistence method would predict ten millimetres of rain for tomorrow.
Trends method
This method involves determining the speed and direction of movement for fronts, high and low pressure centres and areas of clouds and precipitation. Using this information, the forecaster can predict where he or she expects those features to be at some future time. For example, if a storm system is 100 kilometres west of your location and moving to the east at 20 kilometres per day, using the trends method you would predict it to arrive in your area in 5 days.
Climatology method
The Climatology Method is another simple way of producing a forecast. This method involves averaging weather statistics accumulated over many years to make the forecast. For example, if you were using the climatology method to predict the weather for Dar es Salaam on July 4th, you would go through all the weather data that has been recorded for every July 4th and take an average. If you were making a forecast for temperature and precipitation, then you would use this recorded weather data to compute the averages for temperature and precipitation.
If these averages were 33°C with 0.18 inches of rain, then the weather forecast for Dar es Salaam on July 4th, using the climatology method, would call for a high temperature of 33°C with 0.18 inches of rain. The climatology method only works well when the weather pattern is similar to that expected for the chosen time of year. If the pattern is quite unusual for the given time of year, the climatology method will often fail.
Importance of weather forecasting
Weather forecasters alert farmers of the prospects of and amount of rainfall that is expected in a particular area. This enables them to decide what kind of crops to grow. If the forecast indicates little rainfall, then the farmers are advised to grow crops that resist drought or those that take a short time to mature. It, therefore, enables farmers to plan their farming activities well and in advance.
Weather forecasts and warnings are the most important services provided by the meteorological profession. Weather warnings are also important because they are used to save lives and protect property. The forecast saves lives and prevents the destruction of properties. For example, forecasters often warn people about the coming of extreme weather events such as tsunamis, earthquakes, floods, hurricanes or strong winds so that they can vacate their residence to save lives and property. This also enables people to get prepared to face the aftermath of these extreme weather events. In severe weather situations, short-term forecasts and warnings can help save lives and protect property.
Natural disasters such as hurricanes and tornadoes result from certain weather pattern combinations and can injure or kill thousands of people depending on their scope. These disasters often do lasting damage to cities and ecosystems as well. Because of this, being able to predict and understand weather patterns is a very useful skill when preparing for disaster.
Forecast based on temperature and precipitation is very important to agriculture and therefore to traders purchasing, transporting and selling agricultural produce.
Sailing and air travel are also highly controlled by the weather. We often hear of cancellation of air and sea travels due to harsh weather conditions. Accurate weather forecast therefore enables the marine and air transport personnel to schedule their travels in advance.
On everyday basis, people use weather forecast to determine what clothing to wear on a given day. Since outdoor activities are severely curtailed by heavy rain, snow and wind, forecast can be used to plan activities around these events and prepare to survive them.
Weather forecasting in Tanzania
In Tanzania, weather forecast is conducted by Tanzania Meteorological Agency (TMA). This is a government body responsible for weather forecasting and dissemination of forecasting information to the general public. The agency forecasts weather on daily basis and alerts the public about the prospects, intensity and the expected consequences likely to be caused by weather phenomena such as rainfall, storm, sea waves, atmospheric pressure. Information about the forecast is used by the government to protect life and property. It is also used by individuals to plan a wide deal of their daily activities.
- READ TOPIC 4: Climate


Very educative thanks
ReplyDeleteThank you for sharing such great information. It has help me in finding out more detail about Higher Education Loan
ReplyDelete