
MAP READING AND MAP INTERPRETATION
Concept of Map Reading
The Concept of Map and its Importance to Social Economic Activities
Explain the concept of map and its importance to social economic activities
Map interpretation refers to interpretation of the symbols and signs used on map into ordinary language by indicating the features they represent and draw logical conclusions from the information as represented by the symbols.
Importance of map reading
Map reading is very important to social and economic activities. Maps are drawn for different purposes and once drawn they can serve as databases from which various information can be obtained and used for a myriad of social and economic benefits.
- Geological maps provide information about the type and distribution of rocks in an area. This knowledge is of great help to builders who can use it to find out where to obtain certain rocks for construction. This knowledge can also be used by mineral prospectors to locate possible areas where they can obtain mineral. The information on soil types can be used by civil engineers to establish the stability of the on which to build roads and other structures.
- Relief maps provide information to many people in many ways. For example, civil and architectural engineers need to know relief of an area so that they can plan in advance how to overcome relief barriers in their construction plans. It also important to large scale farmers as they need relief to plan for the extent of farms and also to determine the possibility of mechanization (use various machines in agricultural production).
- Drainage maps are useful to civil engineers as they can use them to get prior knowledge on how to construct bridges, roads, railways and other infrastructures. It is also useful to agriculture as such maps indicate possible sources of water for irrigation of crops, watering livestock and for other general farm uses.Weather and climate maps are useful especially to people interested in agriculture. They provide information on the kind of crops to be grown and the type of livestock to keep in a certain area.
- Vegetation maps show the distribution and type of vegetation in a region. This gives a clue on the kind of social and economic activities that can be carried out in an area.
- Soil maps are very useful to agricultural officers as they can use the information about soil types to advise farmers on the type of fertilizers to use, soil requirements and proper soil management practices.
- Maps provide information on the relationship between phenomena or events. For example, maps showing the location of volcanoes also indicate the connection between volcanoes and earthquakes. Earthquakes are very common in areas with numerous volcanoes. This will give people crucial information on the possibility of occurring vulcanicity so that they can avoid setting settlements on such hazardous areas.
- Maps provide background information as compared to present work. For example, maps showing distribution of forests in the past may be compared to the present maps to draw conclusion on the extent of vegetation change through deforestation, afforestation or reforestation.
- Maps provide valuable information for statistical analysis. Therefore, they are very useful to researchers and any field of study.
Essentials of a Map
Identify essentials of a map
Essentials of a map are the necessary prerequisites that a map should have. All maps in general require the following qualities or essentials:
- Title – The most basic component of a map is its title. The title should refer to everything the map covers. It could be a basic name of a country, such as "Tanzania," or it could be more extensive, such as "Water Tables in the Western Saharan Desert." The title should clearly state what the cartographer’s intentions and goals are; it should be specific, and it should not include irrelevant information.
- Scale – shows the relationship between map distance and ground distance. For example, the scale 1:100000, indicates that one centimetre on the map represents 100,000 cm (1 km) on the ground.There are three types of scales: (a) Statement scale – this is a map scale stated in words or it is a verbal scale. The words “one centimetre to one kilometre” is an example of a statement scale. (b) Representative fraction – this is a means of expressing the relative size of a map or drawing by a fraction or ratio e.g. or 1:100. This means that one unit on the map represents one hundred units on the ground. (c) Linear scale/graph scale – this is a line showing the distance on the map that represents a given distance on the ground. A linear scale is divided into two parts: Primary section – it is placed on the left-hand side of the linear scale. Secondary section – this is placed on the right-hand side of the linear scale.
- Key – every map must have a key. The key is a vital tool in understanding and interpreting the map. The key should explain every feature or symbol contained on the map. It should reveal what every marking means and sometimes provide additional information. For example, a city may be represented by a large black dot of a certain size on a map, and the key may explain that this represents a city with a population greater than one million people.
- Margin/boundary/frame – it is essential that all maps be enclosed in a frame for neatness.
- North direction/compass orientation – this is the direction towards the North in those maps drawn to grid system. All maps must have a compass orientation. Because the primary purpose of a map is to provide and insight into directions, a map has to be able to show which way is which on a compass. Most maps have "North" at the top and "South" at the bottom, but all maps should have an official representation of the compass orientation.
- Date – to give context to a map, the date of publication should be present. As maps are continually updated with additional information and improved accuracy, it is important to know the time when your map was published. For example, viewing a map of Tanzania published in 1980 might still be useful but will not be as accurate as one published in 2014.
Reading and Interpreting Topographical Maps
Features on a Map
Recognise features on a map
Topographical maps are types of maps which describe the physical (natural) and man-made (artificial or cultural) features of a given area. The physical features include relief, vegetation, and drainage, among others. Some of the cultural or artificial features are roads, railways, cities, towns, dams, schools, and many other structures built by man.
Relief features
Relief refers to the physical landscape as shown by the configuration of the surface of the earth that is brought about by landform features. The methods of showing relief in topographical maps include the use of spot heights, trigonometrical stations, contour lines and form lines.
Spot height
This is a point on a map with its exact height above a known level e.g. from the sea level. The position and height of the points have been determined by surveyors. The spot height is marked with a dot followed by the numbers indicating height of the land for example .750. The units of height, whether in metres or feet, are quoted in the key of the map as well as below the linear scale.
Spot heights are useful as a guide to the general relief of the area. The map user can easily determine the high points of the area especially where the area represented on the map is an undulating plain or plateau.
Trigonometric station (point)
This is a point on a map with its exact height fixed usually on a hill top, mountain peak or other visible positions. They are the highest points on any locality. The trigonometrical points are commonly marked by a triangle followed by the numbers indicating the height for example Δ725
On the map, the height of each station is written against a symbol. The units of height are not indicated but can be deduced in the same way as spot heights.
Hill shading
Hill shading is a method of representing relief on a map by shading hills as if light is shinning on them.
Hill shading
Hill shading depicts the shadows that would be cast by high ground if light were shining from a certain direction.
Layer colouring/tinting
Layer tinting/colouring is a method of showing relief by colour. A different colour is used for each band of elevation. Each shade of colour, or band, represents a definite elevation range. The key is printed on the map margin to indicate the elevation range represented by each colour. However, this method does not allow the map user to determine the exact elevation of a specific point—only the range can determined.
Hachures
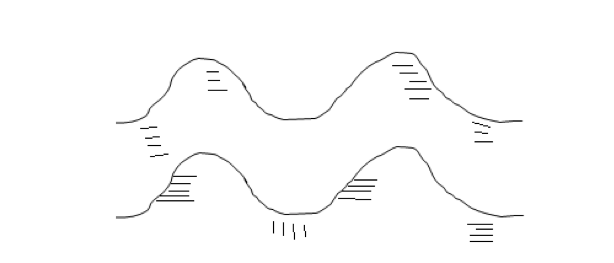
Hachures are short, broken lines used to show relief. Hachures are sometimes used with contour lines. They do not represent exact elevations, but are mainly used to show large, rocky outcrop areas. Hachures are used extensively on small-scale maps to show mountain ranges, plateaus, and mountain peaks.
Hachures are also used to show the direction and steepness of slopes. The lines are drawn to follow the slope of the land or in the direction in which water would run on them.

Hachures
Contours and form lines
Contour lines, sometimes called isohyepes, isoline or isopleth are lines drawn on a map joining all places with the same height above sea level. The value of each contour line is written on it. They are normally drawn in thick brown colour.
Form lines are lines on a map which join points of approximately the same height above sea level. These are used as “fill-in” lines to show out the nature of the slope (form) of the land and the various landforms, hence the name “form lines”. They are drawn by estimating the height of the land with the help of spot heights and trigonometrical stations as well as the contours.
They are usually drawn in thin brown lines and their values are not normally shown on them. Contours and form lines are the main methods of showing relief on topographical maps. For practical purposes, form lines are also regarded as contours. On maps of scale 1:50 000, they are normally drawn in brown colour. Spot heights and trigonometrical stations are also used alongside contours.
Contours do not cross one another for the simple reason that a single point cannot have two different heights. If contours appear on a map to be merging, it is an indication of a very steep slope that is vertical or nearly vertical. The contour of higher value obscures those below it.
The contour interval is the difference in height between any two successive contours. It is also known as the vertical interval (V.I.) of the map. On the 1:50 000 maps of East Africa, the contour interval is usually twenty metres (20 m). This information is indicated in the key accompanying each a map and also indicates the units of height used on the particular map.
The contour interval is constant for all areas of a given map. Contours are very useful as they help in identifying various landforms, including type and trend of slope of the land. The shape formed by a collection of contours enables us to identify different types of landforms. The succession of contours enables us to see the changes in relief.
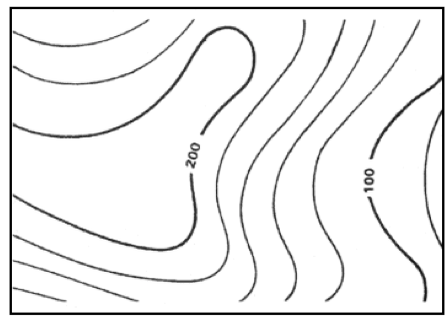
Contour lines showing changes in relief
Slopes
A slope the inclination or slant of the land. This inclination varies considerably, resulting in the following types of slopes:
Gentle slope
This is shown by contours that are evenly spaced and drawn far apart. On a 1:50 000 topographical map, the space between two successive contours is more than 1.5 cm.
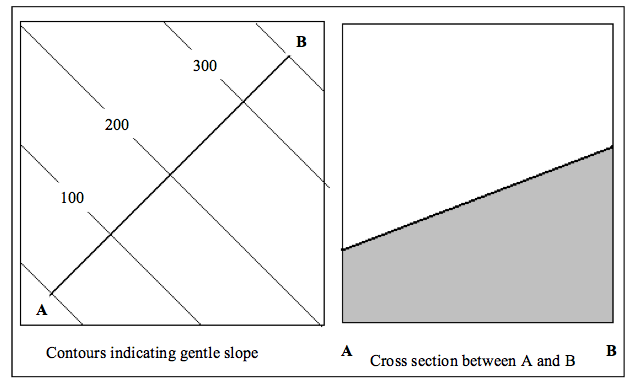
Gentle slope
Steep slope
A steep slope is shown by contours that are drawn very close together. The closer the contours are, the steeper the slope. The space between any two successive contours is less than 1.5 cm.
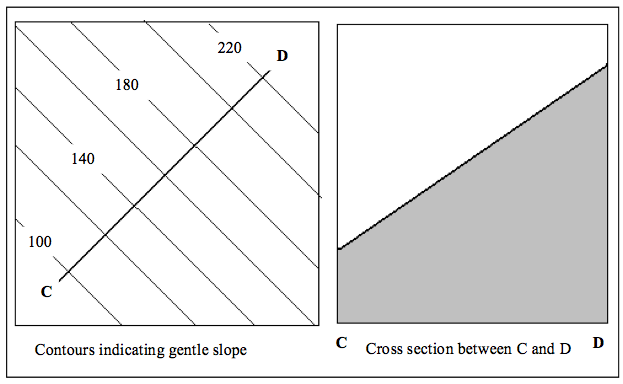
Steep slope
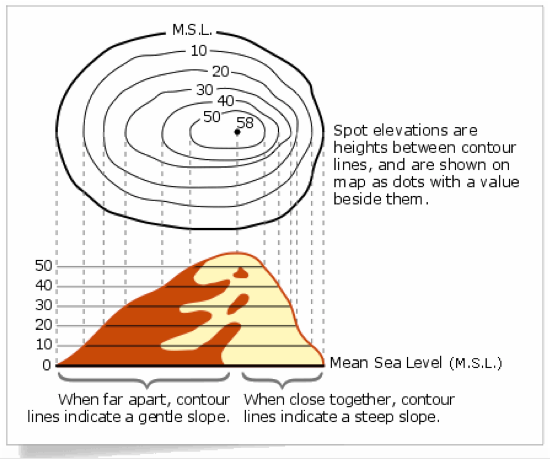
Diagrammatic representation of gentle and steep slope
Regular slope
This is an even or a constant slope. It is shown by contours that are evenly spaced, that is at relatively regular intervals. A regular slope can be gentle or steep. The surface of the land would look smooth.
Irregular slope
This is also known as uneven slope. It is indicated by unevenly spaced contours. It too can be gentle or steep. They indicate a rugged landscape.
Convex slope
This type of a slope is indicated by contours that are closely packed on the lower slope (indicating steep slope) but become more widely spaced on the upper section of the land (indicating gentle slope). The slope curves outwards like the surface of a convex lens. It is steeper towards the bottom and gentle towards the top.
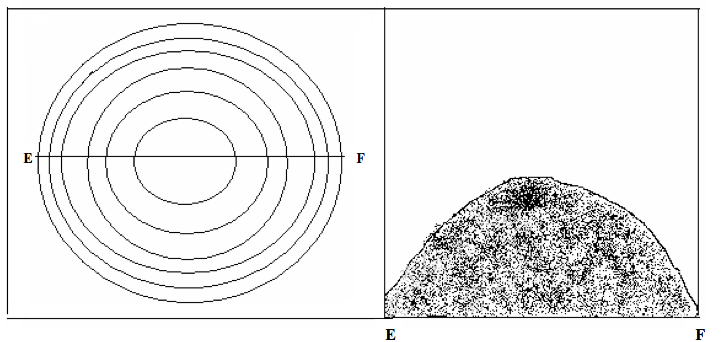
Convex slope
Concave slope
A concave slope is represented by widely spaced contours (indicating gentle slope) on the lower slope and closely packed contours (indicating steep slope) on the upper part of the slope. On this type of slope, the land is steeper on the higher ground and gentler on the lower ground. The slope curves inwards, just the opposite of the convex slope.
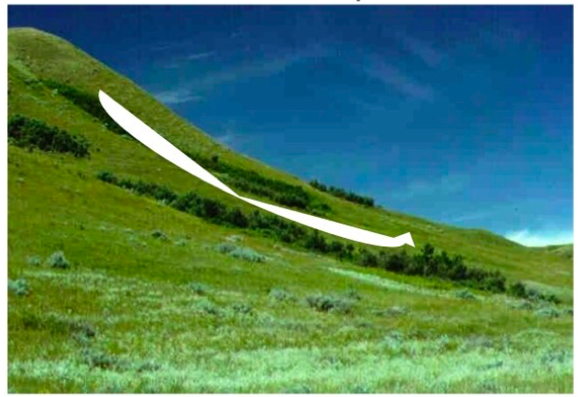
Concave slope
Valley
A valley is an elongated depression sloping towards a drainage basin such as a sea, lake or swamp, and which may contain water or may be dry. On a topographical map, the contours indicating a valley form a ‘V-shape’. The apex (sharp end) points towards the higher ground and contours open out towards the lower ground. The pattern of contours also shows valleys at different stages of development. A valley in its youthful stage is shown by contours that are close together. The gap between contours becomes progressively wider as the valley reaches its mature stage and eventually the old stage.
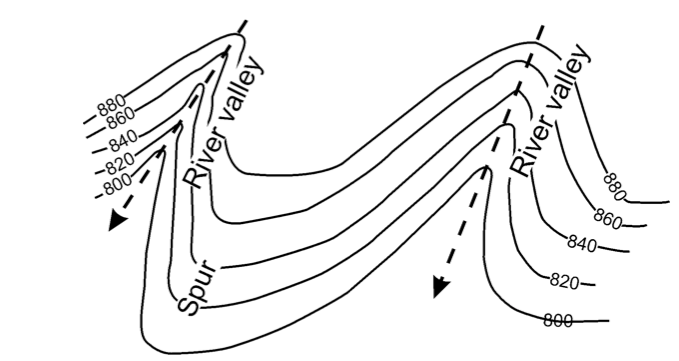
Some valleys may have rivers flowing in them as indicated by arrows in the figure above.
Spur
A spur is also known as salient. It is a prominent projection of raised land from higher ground, such as a hill or mountainside into lower land. Then spurs sometimes interlock, and hence the name interlocking spurs. Spurs are depicted by contours that form a similar pattern to that of valleys. The difference is that in the case of spurs, the apex of the ‘V-shape’ of the contours points towards the lower ground and the ‘V’ opens towards the higher ground (see the figure above). By studying the values of the contours, one can tell which the higher ground is and which the lower ground is. But if the values of contours are not provided, the shape of the ‘V’ alone can suffice to provide this information.
Hill
A hill is an upland that rises above the general relatively low ground but it is of less height than a mountain.
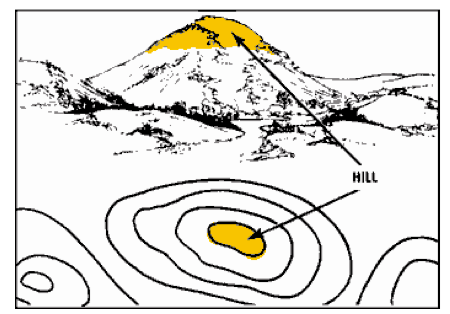
The shapes of hills are quite variable. Some appear to have a regular shape while others are irregularly shaped.
Regular hills look evenly shaped and tend to be conical in shape. On topographical maps, these are depicted by a group of concentric contours that give a hill a rounded shape.
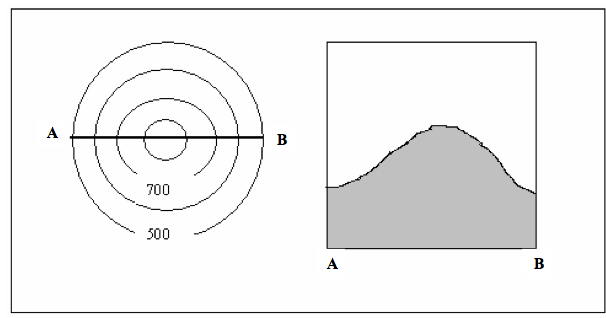
A regularly shaped hill
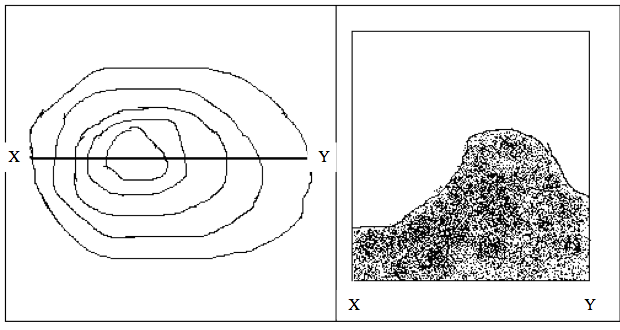
Some hills are irregularly shaped. This may due to erosion, the presence of a massive rock outcrop or due to other geomorphological processes.
Ridge
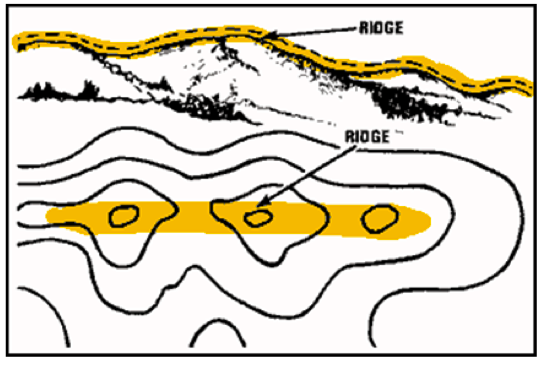
A ridge is a fairly narrow and elongated hill or range of hills with steep slopes on all sides. The top of a ridge may have a number of peaks formed by hills that form a range. Some ridges are watersheds that separate rivers which flow in different directions or parallel to each other. On topographical maps, ridges can be identified by closely packed and elongated contours that drop on all sides into lower ground. The upper part of a ridge is called brow. Before reaching the top of the ridge, there is usually a section of gently sloping land called a shoulder.
Col, saddle and pass
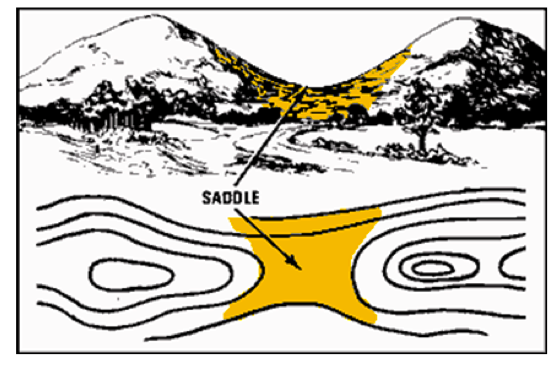
A col is a small depression on a ridge or in a hilly area, which is located between adjacent peaks of hills. In the position of a col, there are no contours drawn. A saddle is described as a broad flat col in a ridge between two mountain peaks. The term saddle is sometimes used interchangeably with col. Their only difference is that a saddle is wider than a col, that is, the two mountain summits separating a saddle are far apart while those separating a col are very close.
A pass is a fairly narrow but deep gap in a mountain range or between high hills in a low land. It is like a deepened saddle or col. Its name originates from the fact that travellers across a hilly or mountainous country would use such a gap for easy crossing from one side of the hills to the other.
Watershed
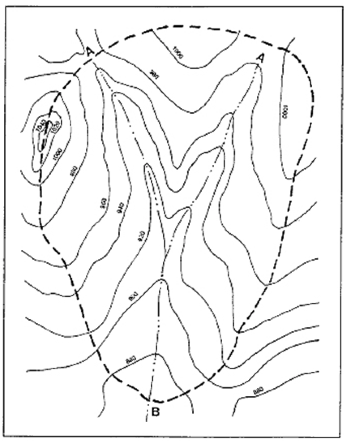
A watershed is a line separating headstreams, i.e., river sources that flow to different river systems. It is a boundary line. On a ridge, it would be the crest of that ridge. On topographical maps, a watershed is not indicated by contours. Its position can be deduced and traced along a line that passes above the last contours of the ridge. Its position can also be determined by examining the direction of flow of rivers originating from that highland.

Watershed
The diagram shows two streams (A) that have joined together to form the main stream (B).
Escarpment
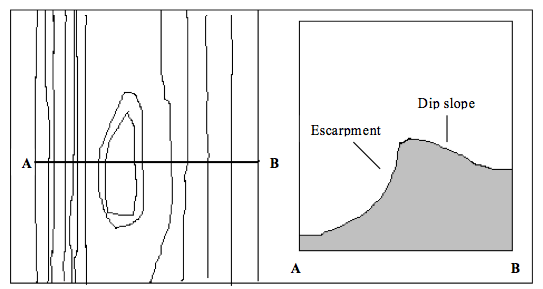
An escarpment is a very steep side of an elongated highland. If it is formed through the process of faulting, it is called a fault scarp. Loosely, the name is used to refer to the whole highland with very steep slopes on one side, a plateau on top and gentle slopes on the opposite side. On topographical maps, an escarpment is shown by closely packed contours on the scarp side that forms a scarp slope, and more widely spaced contours on the opposite side, called the dip slope. The steep side forms a concave slope while the dip slope is fairly even. The tops of some escarpments form plateaus while others, especially the smaller ones, form ridges.
Escarpment
Plateau
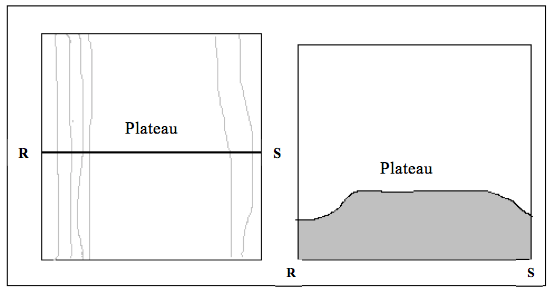
This is an upland covering a considerably large area, and whose top surface is almost flat. It is bordered by steep slopes that lead to lower ground or may rise into the surrounding mountains. On a topographical map, a plateau is shown as a wide area surrounded by a common contour of the same height or two contours that are of the same height on both sides.
Plateau
Plain
A plain is a continuous tract of relatively flat land covering a broad area of lowland. Some plains may be raised but the slopes are very gentle. Plains occur as lowlands and at the bottoms of valleys but also on plateaus or uplands at high elevations.
On topographical maps, a plain is shown by contours that are very widely spaced. Some rivers, if present, may be seen to have meanders.
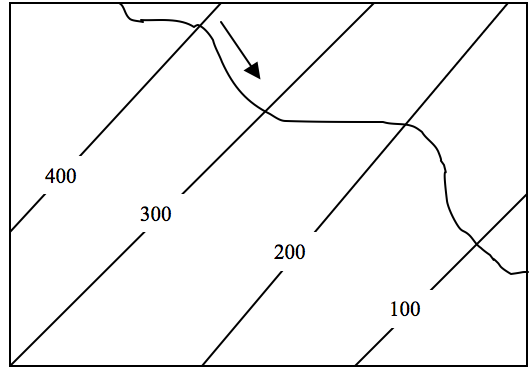
Plain
Depression
A depression on a contour map is shown by contour lines with small marks pointing towards the lowest point of the depression. The first contour line with the depression marks and the contour line outside it have the same elevation.
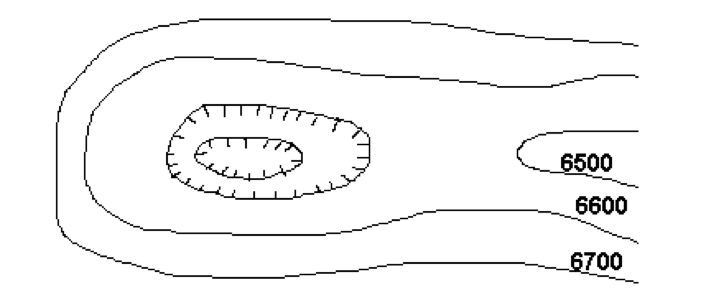
Cliff
A cliff is described as a steep rock face that is vertical or nearly vertical. Cliffs are common in mountainous or hilly areas and along the shores of lakes and seas. On topographical maps, cliffs are shown by contours that are so closely packed that they appear to merge into one another. To emphasize the presence of the cliff, a special symbol is drawn on top of the contours as shown in the figure below.
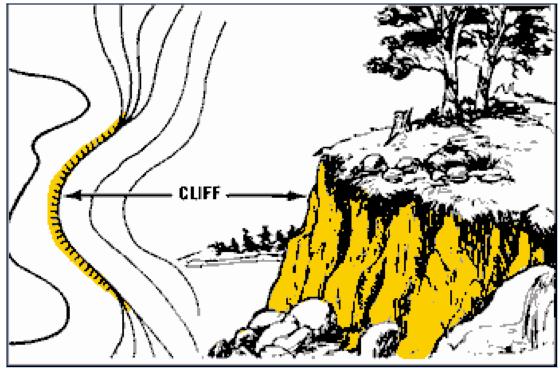
Cliff
Summary of the relief features
The following diagram summarizes some relief features shown by contour lines on topographical maps. The summary can be used as a quick reference when revising representation of relief features on a map.
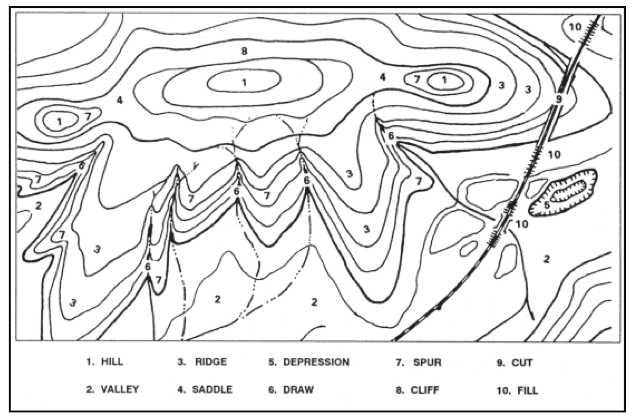
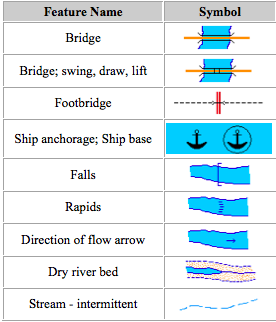
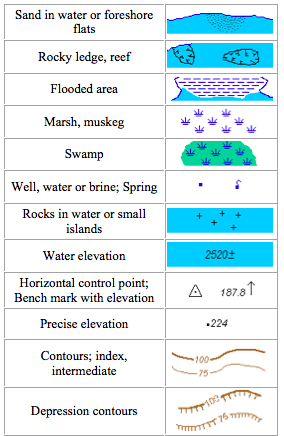
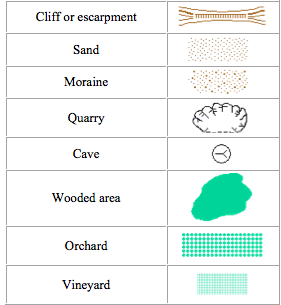
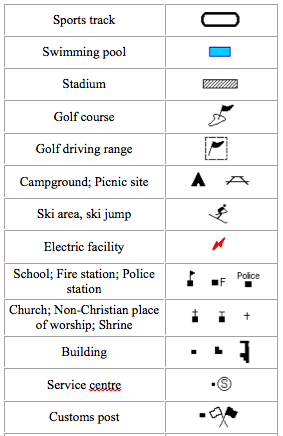
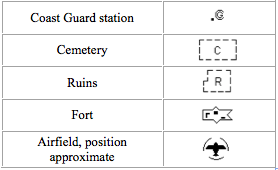
Some relief features are usually shown in the key. The following key shows some of the symbols that are used to depict various relief features on topographical maps.
Information from Maps
Generate information from maps
Description of relief
It is important to be specific when describing the relief of an area represented on a map. The following steps should be followed:
- Provide a general description of the relief of the area. State clearly whether it is mountainous, hilly, a plateau, lowland, valley, etc. State the general altitude of the area by mentioning the possible lowest and highest points and their actual or approximate heights as well as their specific locations on the map. You can get this information from contour lines, spot heights or trigonometrical points. It is important to give as accurate height as possible.
- If distinct relief regions occur on a map, the area should be divided into distinct regions, e.g. highland, plateau, lowland, swampy area, etc. Each area should then be described in detail by mentioning the features present in the respective area. Describe the slopes and ranges in their heights, the nature of slopes, types of slopes, general direction of the slope and the landforms found in the area as well as their characteristics.
- Locate the relief or landform features present in the area and describe their distributions and locations on the map. These features can be located by using grid references, points of the compass or the nearest named places. In case of slopes, describe the type and direction of slope and comparative steepness or gentleness. Use the appropriate terms for describing types of slopes e.g. regular, convex, concave, gentle, etc.
VEGETATION
On topographical maps, only selected types of vegetation are shown. These are forests, thicket, bamboo, riverine trees (also known as galleric or riverine forests), woodland, scrub, scattered trees, palms and swamp vegetation.
The specific swap plants such as mangrove trees, swap trees, marsh plants and papyrus can be deduced from the type of swap shown on the map.
The symbols on the map that are used to represent various vegetation types are often interpreted in the map key.
Describing vegetation
When describing natural vegetation on a topographical map, first identify and name all types of vegetation shown on the map. Then describe each vegetation type separately. Indicate the location of each type of vegetation by using the grid reference or compass direction. For example, one may state “There is a dense forest on the eastern area of the map and mangrove trees along the river.”
If some vegetation types are named on the map, e.g. “Nyandarua Forest”, use the name given to locate the position and type of vegetation. The area covered by particular vegetation should also be estimated and given.
It is important to find out the reason for the particular distribution. These reasons are deduced from the information given on the map, which is referred to as evidence. For example, an area with large permanent rivers indicates that the area receives high rainfall. This may be the reason for the existence of dense forests in the region.
DRAINAGE
Drainage is the natural or artificial removal of surface and sub-surface water from an area. Drainage also includes other features such as lakes, swamps, canals, and ponds which are related to water. However, water tanks and cattle dips are not features of drainage because these features are built by people who also fill them with water. These constructed drainage features are also called hydrographic features. Map makers use blue as the conventional colour for water features.
Rivers and streams
These are referred to as water courses in some maps. They are shown by blue lines. The size of a river is indicated by the size of the blue line. The thicker the line is, the bigger the river. The very thin lines represent streams. The names of some rivers are written in blue print along the lines representing the rivers.
Permanent rivers are shown by continuous blue lines while the broken blue lines represent intermittent (seasonal) rivers. If a river appears to abruptly end somewhere on the land, it means that it disappears into the ground at that point. This implies that at that point where it disappears then rocks are probably very porous or are limestone type or there is a fault line. Normally, a river ends in another river, a swamp, lake or sea. Rapids and waterfalls, like river valleys, are relief features found along a river course and are therefore not in the category of drainage features.
The symbols used to show them on small rivers are not the same as those used on large rivers. These should be carefully studied. The presence of waterfalls and rapids may indicate presence of alternating hard and soft rock along the river.
They may also imply presence of protruding resistant rock outcrops on the river bed or sudden change in the slope of the river bed.
Lakes
A lake is a body of water occupying a sizeable basin, depression or hollow in the ground. It is bigger than a pond. A lake with no indication of water flowing out of it is regarded as an area of inland drainage.
Natural lakes are shown using a light blue shade of stipples. Seasonal lakes are indicated by a series of broken, blue, short lines with the word “lake” written on them or by the name of the lake. Man-made lakes (reservoirs) are shown by a dark blue tint behind a black line that cuts across the river.
Sea
A portion of an open sea is represented by a pale blue colour that is shaded with stipples. Its coastline is indicated by a blue line.
Swamp
A swamp is a wetland with its associated vegetation. Swamps are common where the ground forms a shallow depression. There are various types of swamps and they are shown by different symbols which can be identified in the key. The different types of swamps shown on 1:50000 maps of East Africa are:
- Mangrove swamps – these are found in the shallow parts of the sea shore, and around sea inlets.
- Tree swamps – water-logged areas that have a significant number of trees and some other smaller plants growing in them. There are some water-logged areas where trees are so many that they form a forest. Such a forest is called a swamp forest.
- Papyrus swamp – dominated by papyrus reeds. These are common on plateaus and lowlands.
- Marsh – an area that experiences temporary flooding, and the land is usually wet and poorly drained. It is characterized by plants such as rushes, reeds and sledges, with occasional water-tolerant trees. At the coast, where flooding is due to water, it is called a salt mash.
- Bog – spongy water-logged area with a surface layer of decaying vegetation. The papyrus swamp, marsh and bog are all shown by the same symbols on a 1:50000 scale topographical map of East Africa.
- Seasonal swamp – a very shallow basin and flat area of ground that become flooded during the rainy period for some months, but which dry up during the dry season. On a topographical map, they are shown by a group of broken blue lines.
Ponds, waterholes, boreholes, wells and springs
- Apondis a small mass of stagnant water that is commonly found along courses of small rivers. Most ponds are constructed by people but some occur naturally. They are shown as dark blue areas on topographical maps.
- Awaterholeis a shallow and broad pit that traps rainwater. Some waterholes are natural while others are constructed by people to provide drinking water for livestock or wild animals. For coloured map sheets, the letters “WH” against a small blue circle is the common symbol for this feature. If an alternative symbol is used, it can easily be identified in the key.
- Aboreholeis a deep hole drilled in the ground for the purpose of obtaining underground water. The initials “BH” against a blue circle are used to represent it on a topographical map.
- Awellis a hole, larger than a borehole, which is dug in the ground for obtaining underground water that is fairly close to the surface. This is shown by a blue circle and a letter “W” or letters “We” against it.
- Aspringis a place where underground water flows out from the ground to the surface naturally. It is indicated by a blue circle and letter “S” or letters “Spr” against it. New editions of topographical maps may have these symbols modified.
Note: These symbols are clearly indicated in the key of the map. It is advisable to always study the key before proceeding to identify and interpret the various symbols drawn on the map. Some modifications of the symbols may be expected. So you should not get confused by cramming the symbols off head.
Irrigation canals
An irrigation canal is a channel that is dug in the ground for the purpose of carrying water from a river, well or lake to a farm. On maps, they are shown by blue lines that are usually written against them.
Ditches and drains
These are trenches that are normally constructed in water-logged areas for the purpose of draining water from the land. On a topographical map, they are shown by straight blue lines with some of them having definite angles. The ward “ditch” or “drain” may be written against the line.
Though water tanks, cattle dips and wind pumps are connected with water, they are not drainage features but are cultural features for saving water. The presence of many permanent rivers, streams, lakes and swamps is an indication of high amounts of rainfall received in the area. On the contrary, if many of these features are seasonal, it implies that the area receives low rainfall. Numerous waterholes, boreholes and irrigation canals in an area may also be an indication that the area receives low rainfall and that it experiences water shortage.
Description of drainage
When describing drainage, one should first identify the various drainage features and name them. Describe each feature in turn by describing the distribution of that feature in the area represented and locate it on the map. State the general quantity, volume or size of the feature and describe the characteristics of each, for example, seasonal permanent, big or small, etc. when describing rivers, it is important to comment on the stream density, general direction of flow of the rivers, the sizes of rivers and stage of development, i.e., youthful, mature or old-age. Identify river drainage patterns as well.
Information from Maps in Relation to Daily Activities
Interpret information in relation to daily activities
Human (artificial) features on topographical maps reflect human activities taking place in the area covered by the map. Many human activities are in the form of “land use” which refers to the ways in which land is utilized in the area. The human activities represented on topographical maps include the following:
Agriculture
Agriculture is the cultivation of crops and/or rearing of livestock. In modern times, the term has been expanded to include fish farming, beekeeping and poultry farming.
On topographical maps, crop plantations are shown as light, green shading. A letter indicating the name of the plantation crop may be printed over the shade e.g. “S” for sisal, “Su” for sugarcane and “C” for coffee. These symbols are also indicated in the key.
The name of the crop could also be indicated by the plantation name e.g., Tungi Sisal Plantation. If the name of the crop is not indicated on the plantation, it may be identified using other indicators on the map. For example, the presence of a tea factory, coffee factory or decorticator may imply the plantation crop is tea, coffee or cotton, respectively. In the absence of any indicator of a crop that might be grown on the plantation, there is a possibility that the plantation may be that of trees, i.e., natural or planted forest. Small-scale farming activities are not shown directly on the map. However, they may be deduced from symbols, factories or stores. The presence of a tobacco processing factory or tobacco store implies that tobacco is grown in the area. The presence of flour mill or posho mill indicates that maize is grown in the area.
A ginnery implies that cotton is grown in the area. A cereals board may imply that people in the area grow grain crops such as maize, millet, wheat, etc.
Livestock rearing is indicated by the presence of cattle dips, grazing grounds, cattle markets, ranches,, stock holding grounds, waterholes, a water tank in an isolated place, a slaughter house office or abattoir, a butchery, veterinary office, dairy farm, creamery and dairy farming schools, and many others. Any evidence that relates to livestock rearing is enough to draw a conclusion about livestock farming.
Based on the type of crops grown in an area, one can draw conclusion on the type of climate experienced in that area. For example, tea and coffee are usually grown on an area that experience high rainfall and with moderate temperatures. Crops such as sisal, millet and cassava indicate that the area receives low rainfall and experiences high temperatures.
Likewise, the type of livestock kept in an area can be useful in making conclusions about the climate of that area. Dairy farming indicates that the area has cool climate and receives high amounts of rainfall. Beef cattle farming, pastoralism, ranching and camel rearing all indicate that an area receives low amounts of rainfall. This may be a clear indication that the area experiences a dry climate.
Forestry
The presence of forests and forest reserves on a map indicate that forestry is practised. The presence of forestry can also be indicated by features such as forestry training school, forest station, or forest guard post. The presence of sawmills within or near a forest indicates that lumbering may be taking place in the area.
Fishing
On topographical maps, the presence of water body does not indicate the presence of fishing activities. In conjunction with the presence of a water body, we have to look for the following evidences to conclude, beyond reasonable doubt, that fishing activities are taking place on the water body shown on the map:
- The presence of the symbols of fish traps at the edge of a water body.
- The named places such as fishing village, fish ponds, and hatcheries near a water body. We can also look at the presence of Fisheries Departments, fish markets, Fishing Cooperative Society, a fish processing plant, etc.
Mining
Mining activities are often indicated by a particular symbol that is included in the key. Words such as “Gold Mine” may also be used to conclude that mining activities are taking place in that particular area. Mining, however, should not be confused with quarrying.
Quarrying
Quarrying is the activity involving excavating stones, sand or soil from the ground. A special symbol with the word “quarry” written against it is used on topographical maps to indicate where quarrying is carried out. This is different from mining and that is why both activities are shown by different symbols.
Trading
This is a commercial activity involving buying and selling of commodities. On topographical maps, it is indicated by letters “TC” which are initials for Trading Centre in areas where there are settlements. Other evidences of trading include shops, markets and petrol stations.
Transportation
This involves the movement of people, goods and animals from one place to another. It is evidenced by the presence of transportation infrastructures such as roads, railway lines, footpaths, tracks, airports, seaports, pipelines, etc. The symbols representing these structures are often provided in the key.
Communication
This refers to the means of conveying or exchanging information. The evidence of communication services and activities includes the presence of a wireless station, post office (PO), telegram (Tg), telephone (T) and telephone lines, and a satellite station.
Industries
These are evidenced by the presence of manufacturing and processing factories or industries in an area. They may be shown and named on maps. Examples of industries include sisal and tea processing factories, coffee pulping plant, floor or posho mill, bakery, creamery, cement factory, motor vehicle assembly, fruit processing factory, sawmill, ginnery or simply the word “factory” or its abbreviation “Fcty” are all evidences of industrial activities.
Tourism
Tourism may indicated by such features as camping site, hotel, recreational grounds, game reserve, national park, museum, historical monument, tourist resort, historical sites and nature reserve.
Administration
Various administrative activities can be identified from abbreviations on the map. These are given in a list in the margin of the map. They include provision of security as evidenced by the presence of a Police Station or Police Post, judicial services as evidenced by the presence of courthouse, and other administrative offices such as District Commissioner (DC) and Regional Commissioner (RC).
Other human activities
Besides the activities described above, there are other activities that people engage in on daily basis. These include teaching and provision of other education services indicated by the presence of school, college, university or training institution.
Health services are indicated by the presence of a hospital, dispensary, health centre or medical laboratory.
Religious services are indicated by the presence of church, mosques or temple. Recreational services are evidenced by the presence of golf clubs, golf courses, stadium or other recreational grounds.
Description of human activities
When describing human activities in a given area on a topographical map, the following steps should be followed:
- Identify each activity and support it with evidence form the map.
- Describe the distribution of the activity in the area of the map using conventional methods.
- Give reasons, using available evidence, for the distribution of and factors that may appear to favour the activity.
INTERPRETATION OF SETTLEMENTS
A settlement is a place where people dwell. On topographical maps, settlements are depicted by dots or blocks, which may be black or grey in colour. Dots are identified in the key as huts or houses. They represent semi-permanent structures that are typical of rural settlements in Africa.
Black squares or rectangular blocks depict permanent buildings like those built of stones or bricks and roofed with iron sheets or tiles. A collection of these permanent buildings in one area is shown as a solid block. This represents a town or an area with permanent buildings.
Description of settlements
Settlements are described based on their concentration or alignment. In terms of concentration, they may describe as follows:
- Dense – when there is a high concentration of individual blocks or dots in a given area.
- Moderate – when f individual blocks or dots are neither high nor low.
- Sparse – when individual blocks or dots are few and spread over a wide area.
On the basis of alignment, settlements can be described as follows:
Nucleated or clustered
In this pattern, settlements are in groups or clusters. The reasons why settlements are concentrated in a particular area include the following:
- A limited land for settlement.
- Security and defence – in rural areas people may need to live in groups for collective defence.
- Availability of social services such as educational, health, transport, and communication facilities
- Availability of economic opportunities like mining, trade, employment, etc.
- Conducive climatic conditions which favour a better living such as the absence of diseases or disease vectors such as tsetse flies, mosquitoes, etc.
- Fertile soils which favour agricultural activities.
- Government policies – the government’s land policies can also have a lasting effect on location of settlements. For certain reasons, the government can set up policies which prohibit establishment of settlements in particular areas.
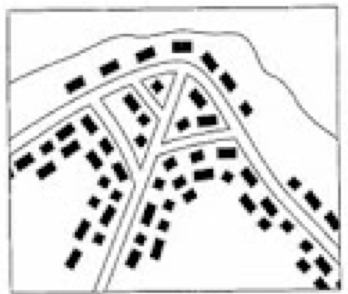
Nucleated settlement
Scattered or dispersed
In this pattern, the settlements appear to be randomly dispersed over the area. It is typical of rural areas where people own individual pieces of land and set up their own dwellings anywhere on their lands. It can be found in new settlement schemes. The distribution may be any of the types discussed above. The factors behind this type of settlement include the following:
- Readily available land for settlement without any restrictions.
- A fertile soil that attracts a large population. The land is sub-divided into small plots.
- Availability of water within easy reach by families.
- Generally reliable security over a wider area. There is therefore no need for group defence measures.
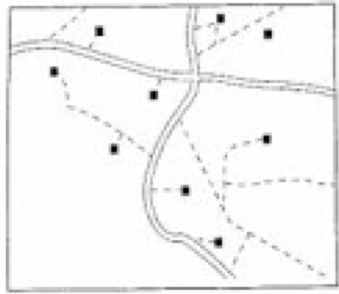
Scattered settlement
Linear
In this pattern, settlements are set up in a line form along certain features such as roads, railways, coastlines, etc. Some of the factors leading to development of this pattern include:
- Presence of a road, motorable track or footpath for easy transport.
- Presence of a river that may provide water for domestic and commercial use.
- A coastline or shoreline that is favourable for fishing.
- Suitable terrain, e.g. the foot of an escarpment where the slope is gentle and where they may be scarp springs for water.
- Infrastructure planning like in plantations where settlements are set up in lines.
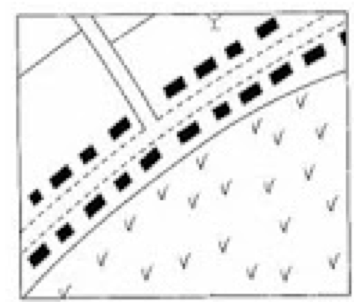
Linear settlement
Besides describing the distribution of settlements in terms of the density and patterns, the factors that influence their distribution should be identified by examining the map carefully. Such factors include relief, vegetation, drainage, transport and other economic activities as may be found indicated on the map.
Note: The description of settlement as dense, moderate or space is often termed as forms of settlement and description as scattered, linear or nucleated is termed as settlement patterns. So, one should not confuse the two terms when referring to settlements.
- READ TOPIC 6: Photograph Reading And Interpretation


No comments:
Post a Comment